No one wants to run out of money in retirement.
And make no mistakes, when you retire, your whole financial life comes down to one question. Will you outlive your money? Or will your money outlive you? Those are the only two possibilities, and the difference between them the difference between dignity and independence on the one hand and hoping against hope that your kids can support you in your old age.
And who wants to have to go to their own kids, begging for money, during the golden years?
I’m exaggerating here a little bit except that I’m not. Investing for retirement is truly difficult, and we live in a world where almost none of you were really taught how to do it. So with all that out of the way, let’s get started.
Part 1: The number
The first thing we need to do is figure out how much money you need your portfolio to provide you with each year in retirement. If you look at other websites, you will find all sorts of opinions like, “You need to be able to replace 60% of your working income” or whatever. Hogwash. Everyone is different.
What you do need to do is come up with a reasonable estimate of how much you are going to spend in retirement. For a lot of people, this is not easy. If you are in the group that has a hard time estimating your yearly spending in retirement, here’s a good place to start. Figure out how much you spend now in a month, reduce or increase the amount by anything that you know for a fact will change in retirement, and just multiply it by 12.
Next, figure out how much Social Security you’ll get plus any pensions. Now, subtract your Social Security from your yearly spending. That’s the number we’re looking for. That’s how much yearly income you need in retirement.
(Side note: I strongly recommend people use inflation-adjusted numbers for everything when doing financial planning. In other words, I strongly recommend that people not “poof up” their expected returns by including inflation in the returns. So if you expect stocks to return 9% per year, then subtract 3% per year for inflation. If you do this, then you can do ALL your financial planning in today’s dollars. If you don’t do this, honestly, things get really confusing. Most financial planning tools poof all the numbers of by inflation, then they deflate them later on. I adamantly disagree with that method. Do everything in today’s dollars the whole way through and this process is much easier.)
OK, so you’ve got your number. You know how much yearly income your portfolio needs to provide. Now the question is, how do we know your portfolio can provide you with that income?
How do we know you won’t run out of money?
Part 2: Safe withdrawal rates and math
The following is the one and only table I use with every single student, client and friend who asks for help with investing. It’s called a “Historical Safe Withdrawal Rate” table. What it shows is the historical ability of portfolios to survive even though you are taking out money (and again, everything here is in real dollars, so we have taken inflation into account the whole way through.)
What I’ve done is I looked at the past, back to 1927. And I looked at the worst period of time a retiree could have chosen to retire. Then I asked–if the retirement lasted 10 years, 20 years, 30 years or 40 years, how much could the retiree have taken out of their portfolio without having the thing go bust?
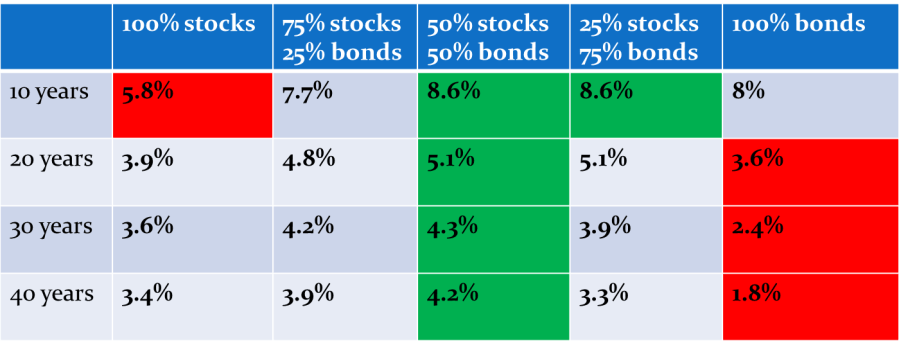
So in other words, I looked at the worst period of time in all of history, and figured out the highest safe withdrawal rate during that worst period. The thinking here is that it’s very unlikely that, in the future, we will have catastrophes that were even worse than the Great Depression or the stagflation seventies. Therefore, if a portfolio withdrawal rate could have survived those catastrophes, it will probably survive whatever the future throws at it.
What do the percentages mean exactly? Let’s take the 50/50 portfolio at a 40 year retirement. You see there, highlighted in green, that you would have had a 4.2% safe withdrawal rate. This means that if you had a $100,000 portfolio, you could have taken out $4,200 in the first year, increased that $4,200 by the rate of inflation every year, and your portfolio would have survived even the worst 40 years you could have chosen to retire. And yes, you would run out of money at the end. But remember, we’re intentionally looking at the worst 40 years ever. In most 40 year periods, you’d have plenty to spare at the end.
Here are the safe withdrawal rates for a 100% stocks portfolio:
For a ten-year retirement: 5.8%
20 years: 3.9%
30 years: 3.6%
40 years: 3.4%
For reference, the worst year you could have chosen to retire was 1929, the beginning of the Great Depression. Here’s the important number. Even for a 40 year retirement, you could have withdrawn almost three and a half percent of the original portfolio value, kept that amount up with inflation, and your portfolio would have survived. That’s actually pretty good, given how risky the stock market is, and given how much inflation can happen over 4 decades.
Here are the safe withdrawal rates for a 75% stocks portfolio:
10 years: 7.7% (Notice how much this number went up compared to all-stocks!)
20 years: 4.8%
30 years: 4.2%
40 years: 3.9%
Here are the safe withdrawal rates for a 50% stocks portfolio:
10 years: 8.6%
20 years: 5.1%
30 years: 4.3%
40 years: 4.2% (Notice that all these numbers are higher than the all-stocks or 75% stocks portfolio.)
In both cases, the worst year was 1965. This was the beginning of stagflation. You could have withdrawn 4%. And when I say 4%, I mean that, if you had a million dollar portfolio, you could have taken out 40k in your first year (40k is 4% of a million.) Then, even if inflation was 10% the next year (and it often was 10% or higher in the 70’s!) you could take out 44k that year. And so on. And your portfolio would still have survived that inflation.
I mean, in the 70s you might find bank accounts yielding 13%. But with inflation running along at 14%, were you really coming out ahead? No, you were losing money every year!
Speaking of inflation, most people might think to themselves that, for bond-heavy portfolios, inflation would be the big enemy. Well it is certainly an enemy. But really, the biggest enemy was just low interest rates. In during World War II interest rates hit lows that would not be seen again until the decade after the financial crash of 2009.
For someone who wanted a low-risk portfolio, the worst time to retire would have been the 40’s. Here are the safe withdrawal rates for a 25% stock portfolio and a 0% stock portfolio.
For the 25% stocks portfolio:
10 years: 8.6%
20 years: 5.1%
30 years: 3.9% (Notice that now the withdrawal rates are starting to go down compared to the more “risky” portfolios.)
40 years: 3.3% (This is even worse than the withdrawal rate for a 100% stock portfolio.)
Now for the 0% stocks, 100% bonds portfolio:
10 years: 8%
20 years: 3.6% (Ouch!)
30 years: 2.4% (Yikes!)
40 years: 1.8% (Yep, time to break out the dog food.)
Look at how terrible that safe withdrawal rate is for the investor who wants to avoid stocks altogether! Learn from the past! It’s not safe to try to avoid risk altogether. Low rates combined with inflation can destroy your nest egg. As a result, every retiree should embrace diversification.
But the most important concept these tables show is the concept of the “4% Safe Withdrawal Rate.” This concept is used in investing literature all the time, and is often abbreviated as 4% SWR. What does it mean? Notice that, even for retirements as long as 40 years, even in the worst case scenario, even though you constantly increased your withdrawals by the rate of inflation, you could have withdrawn 4% of your original portfolio value as if it were a pension. You could have taken that out every year, and your portfolio would have survived.
This indicates that a 4% withdrawal rate is “historically safe”. So if you’ve got a million dollar portfolio, based on history, you can safely withdraw 40k per year. If you’ve got a half-million dollar portfolio, you can safely withdraw 4% of that half-million, which is 20k a year. If you have 100k, you can only safely withdraw 4k per year.
For many people this is a sobering number. And it’s true that we are looking at worst case scenarios here. So let’s talk a little bit about why some people might not want to get stuck on being “historically safe”.
Part 3: Actual spending
What about your own spending? Will you really increase your spending by the rate of inflation every year? If not, you may not want to get so hung up on that four percent number. Most retirees will be fine with a 5% withdrawal rate, and here’s why:
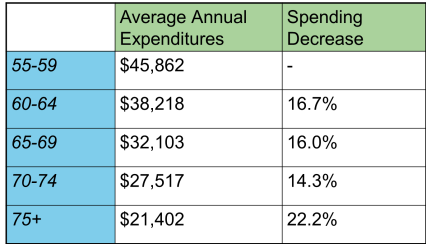
Can you guess what that chart shows? It shows a Department of Labor and Statistics survey of the spending habits of older Americans. As you can see, people just spend less as they get older. And this pattern has held true for as long as this survey has been done. In other words, it’s not a cultural issue. It’s just an actual pattern.
Still, especially for younger investors who have plenty of time to save and invest, I hope you will aim to get a portfolio large enough to support a stress-free withdrawal rate.
But the point is, everyone is different. You have to know for yourself, is your spending going to go up or down when you retire? If you are a “normal” retiree, and it’s going to go down, then feel free to withdraw more early on.
On the other hand…do you want to retire early? OK, then let’s be realistic here. Most early retirees don’t spend less. They, actually, spend more. If early retirement is your goal, you probably need some specialized advice and planning.
Now let’s talk about how all retirees can lower their risk of running out of money.
Part 4: Lowering risk
The most important thing to notice about the safe withdrawal rate tables is that the portfolios with combinations of stocks and bonds had higher safe withdrawal rates than the portfolios with only stocks or only bonds.
This is interesting because in all 40 year periods, stocks had the highest returns. Similarly, bonds always had the lowest risks. But an all-bond portfolio wasn’t the least risky portfolio, and an all-stock portfolio wasn’t the portfolio that necessarily allowed you to withdraw the most money. Combining the two was the least risky strategy, and the one that gave you the highest floor on your retirement income stream.
Why? Math. In retirement, bad luck in the order of returns can screw you up.
If you just put one dollar in the markets and let it grow, it makes no difference in what order the returns come. You end up in the same place regardless. But if you are taking money out each year, it does matter. Bad years in the beginning can mess up your whole retirement.
Here is a chart I made to show the problem. These two series of returns are exactly the same, but in opposite order. If you invested $100,000 and never withdrew a penny, you’d end up in the same place either way, with $161,000. But if you withdraw $5,000 per year, at a 5% rate of inflation, the results are different…
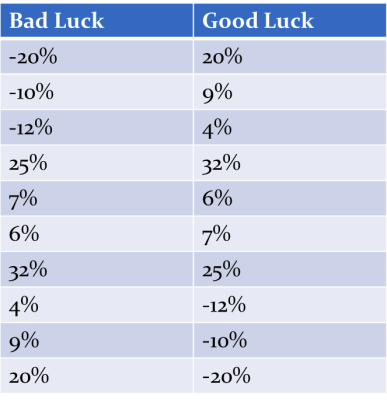
Good luck: You’ve got $104,000 left.
Bad luck: You’ve got $59,365 left.
Quite a difference, no? You can look at this several different ways. One way to look at it is that, when the down years come early, you have to sell more shares to get the same withdrawal. The other way is to just see that withdrawing money during a bear market in the beginning digs you into too deep a hole. However you choose to look at it, this is the problem retirees face. You have to have some returns or you might run out of money, but you can’t take too much risk…or else you might run out of money.
This is the primary reason why younger investors really can afford to take more risk than older investors. They can absolutely afford to be more aggressive.
Besides diversification, there are a few other methods of lowering risk in retirement. They might not be as popular, but I want to at least mention them.
First, you can use immediate annuities (not to be confused with garbage like equity indexed annuities or “guaranteed return” variable annuities) to reduce risk. Here’s how an immediate annuity works. You give the insurance company some money and you get a payout every month. You’re basically buying a pension from the insurance company. This can be a good deal, especially if you expect to live a long time.
When mentioning annuities I have to make sure I am clear. Avoid anything that’s not like a simple pension. Avoid anything that deals with “guaranteed returns” or that promises you that you can “participate” in stock market gains with no risk of losing money. These products always have pages and pages of fine print, and the result is always that you get screwed.
Second, you can use Treasury Inflation Protected Securities (usually known as TIPS.) These are a specific kind of bond that pays you a yield plus the rate of inflation every year. As long as you hold them until maturity, they can’t lose money to inflation and, in fact, they just can’t lose money period. Of course, the yield is very low, but that’s the price you pay for safety.
Thankfully, there are ways to improve the risk/return profile of your stock investments while retired, which may allow you to have a less risky overall portfolio and still meet your goals.

Part 5: The benefits of diversification
Earlier we discussed the fact that using both stocks and bonds improved your withdrawal rates. Diversifying among the stock section of your portfolio can produce similar results.
Diversification can lower your risk of running out of money even if it doesn’t increase your returns.
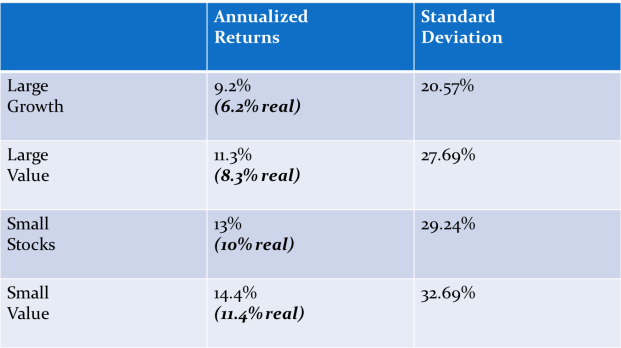
With stocks, the first step to diversification is to use both US and International. The next step is to use both Large and Small stocks. The final step is to diversify using value stocks (which are stocks that have a low price relative to their book value.)
Why divide markets up in this way? For decades researchers have asked, “what causes some groups of stocks to behave differently than others?” For a long time people thought that maybe the industry mattered, or the profitability of the company. But as it turns out, there were only two distinctions that really mattered. First, was the company a large company or a small one? Second, was the company high priced (relative to its earnings or book value)?
Small stocks are riskier than large ones and have higher expected returns. Value (low-priced) stocks are riskier than high-priced ones and have higher expected returns. But that is not what’s really important. What really matters is that those risks show up at different times. This means that small stocks don’t always go up and down at the same rate as large ones do, and value stocks don’t always move with the market either.
And this is what we’re always looking for. Diversification means investing in things that do not go up and down at the same time.
Here is an example of how different the returns of large and small stocks are, and how different value stocks are. Here is a chart of the returns from 1927 until the present:
But again, the point here is not that such stocks have high returns. The point is that, even though they are quite risky, the risks don’t always show up at the same time as general market returns. So here is what happens, decade by decade, when you use a portfolio that is 25% Large, 25% Large Value, 25% Small and 25% Small Value with just US stocks.
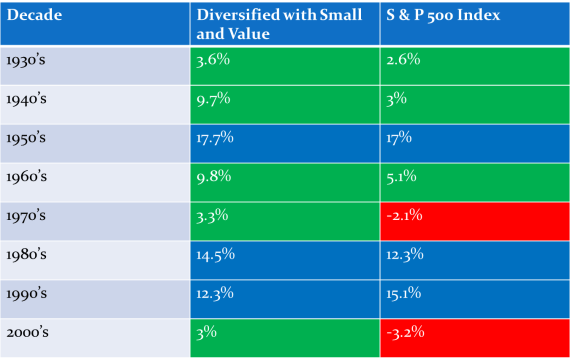
Fascinating, no?
Check out the two worst decades for the US stock market as a whole: the 1970s and the 2000s. Those were not fantastic years for the diversified portfolio either, but the diversified portfolio did a heck of a lot better than the US market.
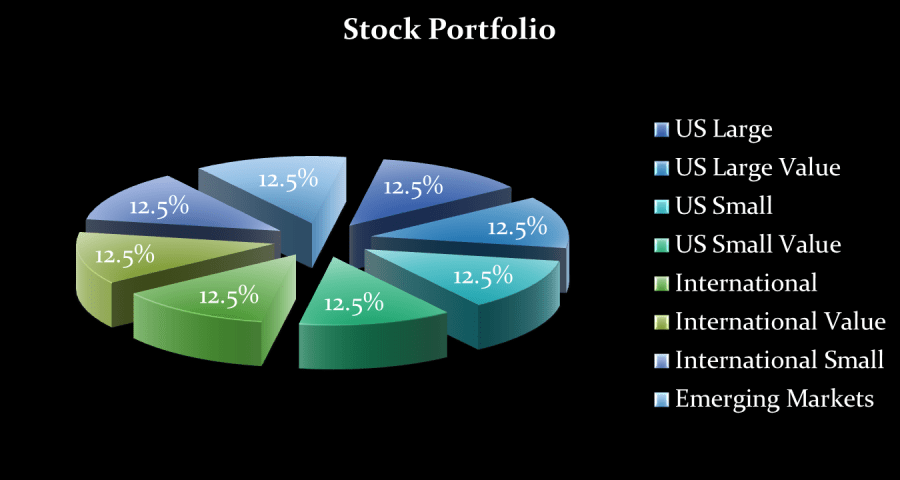
Now let’s see what happens when we add International to the mix. So now we have a portfolio of eight asset classes: US Large, US Large Value, US Small, US Small Value, International Large, International Large Value, International Small, and International Small Value (12.5% in each.)
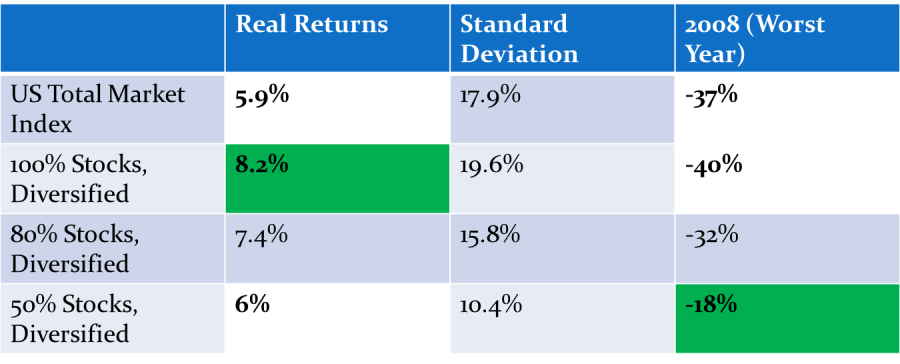
So now we see the real value of diversification for a retiree. If you diversify with small and value, you can afford to have less money in the stock market and still have better returns. So you can use risky assets that don’t go up and down together with less risky assets (like bonds) to keep returns high with much less overall risk.
In the future, will such diversified portfolios do as well as they did in the past? Well, there are a couple of problems. The most important problem is that, with bond yields as low as they are now, it’s unlikely that bonds will contribute much in terms of returns to the portfolio. So I wouldn’t expect a 50/50 diversified portfolio to do as well as a 100% US Stock portfolio in the future.
But the benefits of diversification will still be there.
So, let’s say you are a retiree and want to set up a diversified portfolio for your retirement. What should you do? First, you can set up such a portfolio at Vanguard with index funds on your own. The portfolio isn’t “perfect” because you are using a separate Emerging Markets fund instead of International Small Value, but it will perform very similarly to the “perfect” portfolio.
Divide the stock funds evenly and just use the Total Bond Index for bonds. Here are the funds you can use to set it up:
Total Stock Market Index, US Large Value, US Small, US Small Value, Total International Index, International Value, International Small, Emerging Markets. And for bonds, Total Bond Index.
If you don’t want to do this on your own, there are certainly financial advisors out there who can put together a diversified portfolio for you. I would only caution you that if you don’t understand how to do this on your own, you won’t know whether an advisor really knows what the heck they’re doing either.
So that’s investing in retirement! Remember that you can always use those simple strategies we discussed in a previous class and put investing on auto-pilot while you enjoy life. For many people retirement is the happiest time of their lives. There’s no reason to let money stress infect that happiness.

Take care, keep investing simple, and remember–Stay the course.
Take the Class Exercises
Move on to the next class: Figure out how much you need to save now
Return to the list of classes
